In a few previous entries, we looked at how to capture, parse, and evaluate the precision of a NMEA-capable GPS. The next step is to take it on a test drive.
The setup is simple: a laptop, a USB GPS, a car, and a map. The map is provided by Google Maps, of course. The car and the laptop do not really matter (as long as one of the two runs Linux and has a USB port); the USB GPS is the Columbus V800.
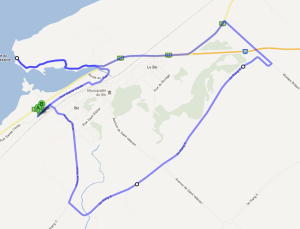
So it’s a glorious sunny late Saturday morning, I pack everything in the car (with the computer on the passenger’s seat) and drive more or less aimlessly in the countryside, back on the haven, then back home. The drive, in Google Maps, looks like:
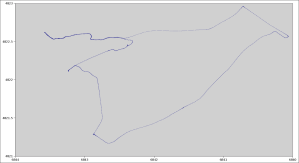
Launching the script described in a previous post, get gather the GPS data points:
which reassuringly shows the same outline as the Google Maps map. Now, we know that consumer-grade GPS aren’t that precise because of design limitations (i.e., explicit crippling of the protocol). In theory, if we looks at the precision of the GPRMC sentences, we should get in the order of 18.55 cm (or about 7.3 inches) precision. The format is ddmm.mmmm, where dd is in degrees, and mm.mmmm represents minutes with 10000ths. Since 1° is 111319.9 meters at the equator (it varies somewhat elsewhere, as the earth is an oblate spheroid), 1 minute is 1/60th of 1°, or about 1855.33166 meters; one 10000th of that is 18.55 cm.
However, despite this theoretical precision, the actual precision is far less. It depends on how far apart and how numerous are the satellites used to compute the tracking. A vague estimate of error is given in the NMEA sentences as the dilution of precision, a dimension-less number proportional to the squared error obtained while solving the simultaneous equations (that’s the intuition you should get about DOP). Unfortunately, it does not translate into meters, at least not directly. The horizontal dilution of precision (HDOP) gives you the error on the tangent plane, the vertical (VDOP) gives you the error on the altitude; and the PDOP combines the two to give you the x-y-z error (in the space of the equations; not in meters).
One can loosely translate the DOP in meters. Estimating all kinds of errors to about 6.7m (see for details on UERE), we have, in meters:
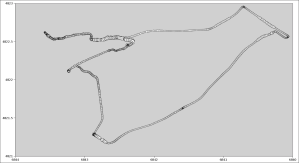
(with an extra m error). Fortunately, PDOP is readily available in the GPGSA sentences. Since the error, in meter,is at a multiplicative constant equivalent to the PDOP; we can use the PDOP as a proxy to error and use it in the graphical display of error. Re-displaying the last graph:
Curiously, the confidence doesn’t seem to be correlated with speed (some stretches are 70–90 km/h provincial roads). No, it’s correlated with the number of satellites and the quality of signal. The biggest circles (biggest DOP) are in deep-set streets, with a river on one side and steep slopes on the other, or under bridges.
*
* *
At first, I was expecting to have to clean up the data considerably, filtering weird outliers, smoothing curves, or whatnot, but it turns out that the data is rather clean from the start, and, despite varying DOP, show smooth transitions everywhere. Easy enough, then, to map this information in to some GIS and have a navigation application, although, that’s not exactly what I have in mind for these experiments.
To be continued…


[…] entries, I’ve toyed with GPS, either getting or parsing the data with Bash, assessing or using the GPS data. However, when we use GPS, we suppose that the precision varies by brand and […]